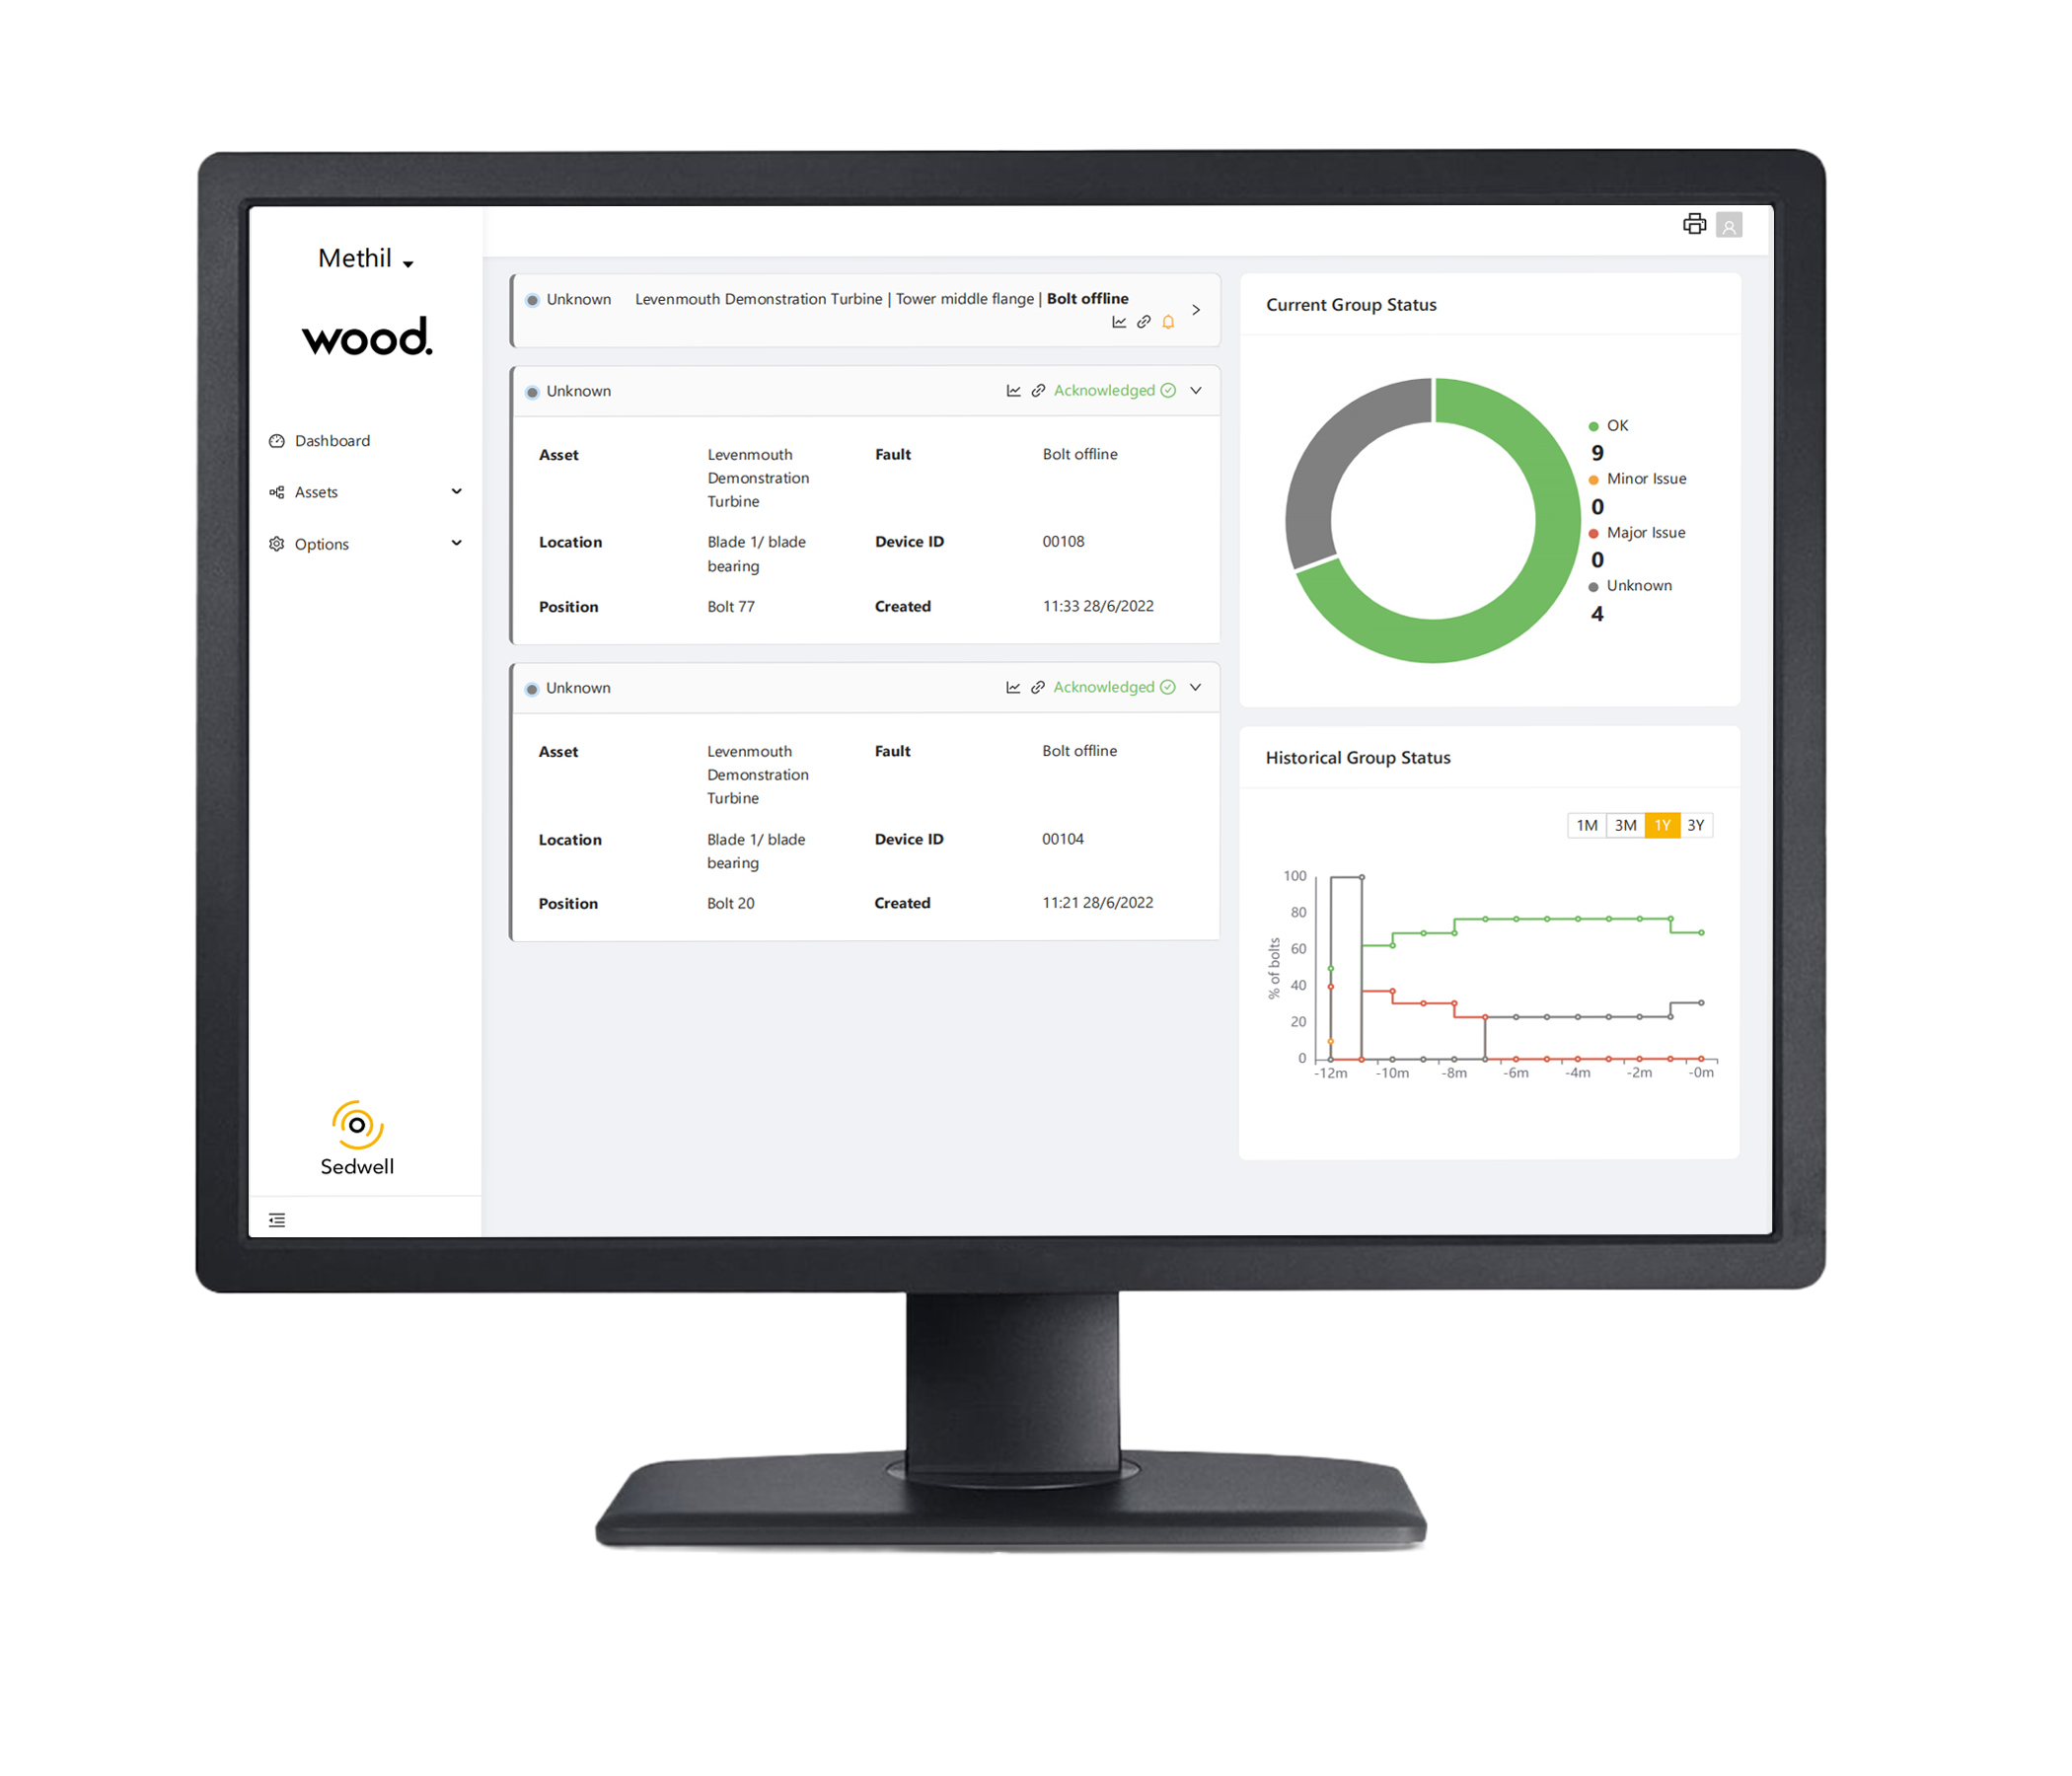
Checking the tightness of bolted connections typically requires manual tools operated by on-site technicians which is prone to human error, costly, results in asset downtime and presents several health & safety risks. With the InterBolt Gateway and Cloud system, the tightness of bolted connections can now be remotely monitored in real-time, therefore eliminating the need for onsite inspection.
InterBolt Gateway
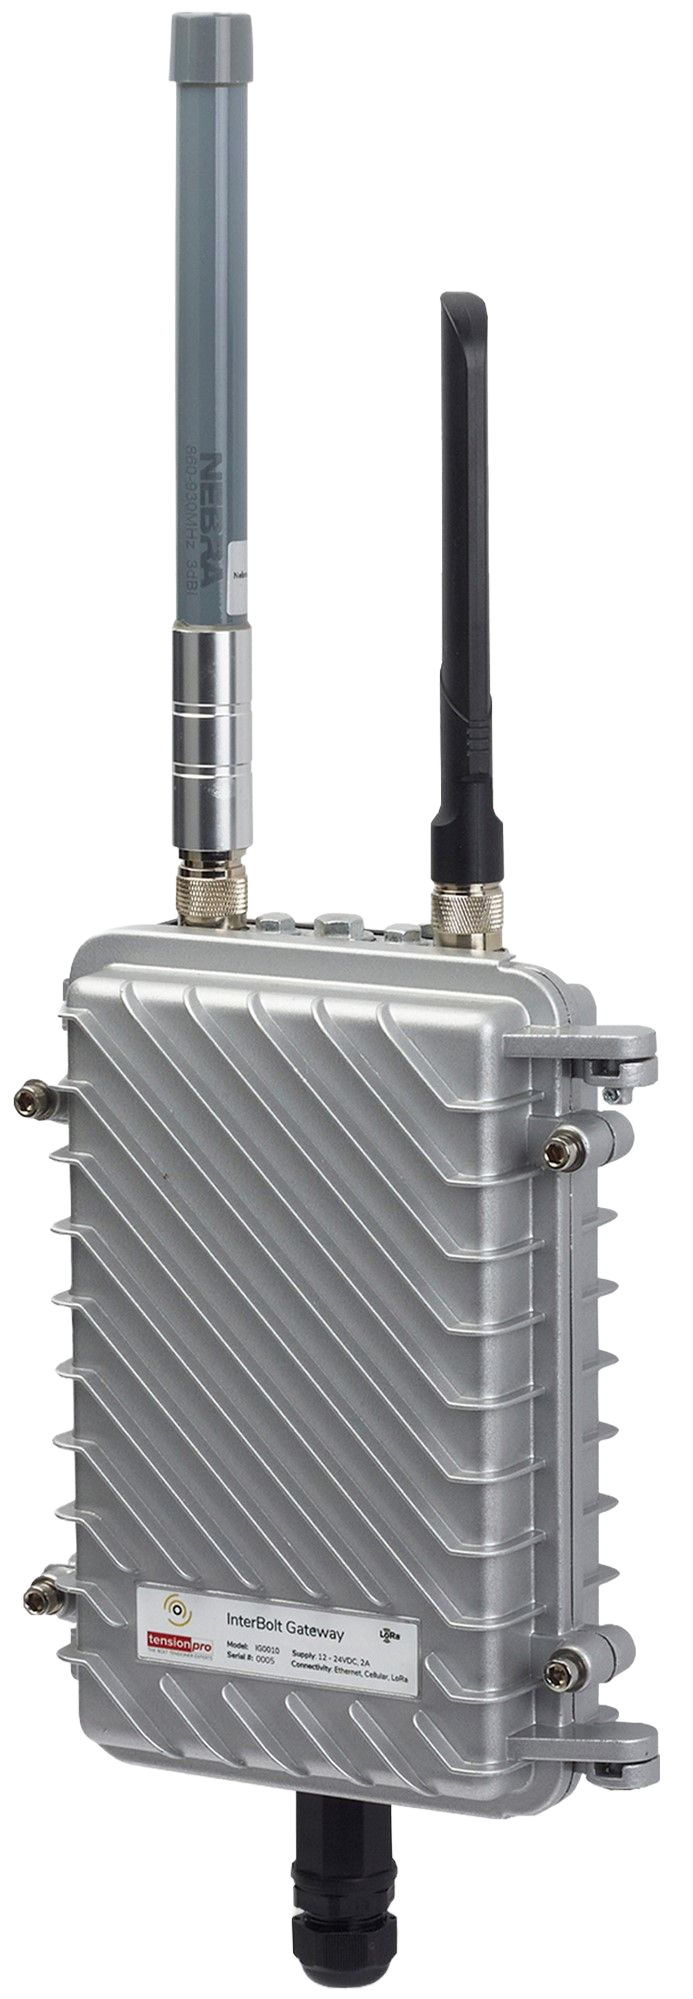
The InterBolt Gateway connects InterBolt sensors to a remote network to enable continuous and autonomous bolt load monitoring without the need for technicians to be onsite. Specifically, it is a data concentrator and gateway used to capture data from InterBolts over the local LoRa network and forward this to either the InterBolt cloud system or a third-party cloud system over an Ethernet, Cellular or Satellite connection.
The InterBolt Gateway is designed for harsh environments, with an ingress protection rating of IP67. There are various mounting options including; pole mount, VESA, magnetic or DIN rail mount to suit any application.
The InterBolt Gateway is ‘plug and play’ but also features an embedded web server for management and setup.

InterBolt Cloud
The InterBolt Cloud is the platform that Operations teams use to remotely monitor bolted connections.
In the InterBolt Cloud, bolt load samples are:
-
Stored.
Bolt load samples from installation to decommissioning are stored so a full historic overview of the bolt life is known.
-
Analysed.
The cloud system features simplistic analytics engines which can generate an alert when the bolt load exceeds a predefined threshold or is trending towards a certain state.
-
Visualised.
The cloud features a huge range of visualisation options: from visualising the bolt load from a single sensor, to overlaying the status of bolts on a 3D model of the asset.
For organisations with established condition monitoring systems, the InterBolt data can also be integrated into third-party systems either at a ‘Gateway level’ through its configurable endpoints or at a ‘Cloud level’ through an API.
Historical bolt load
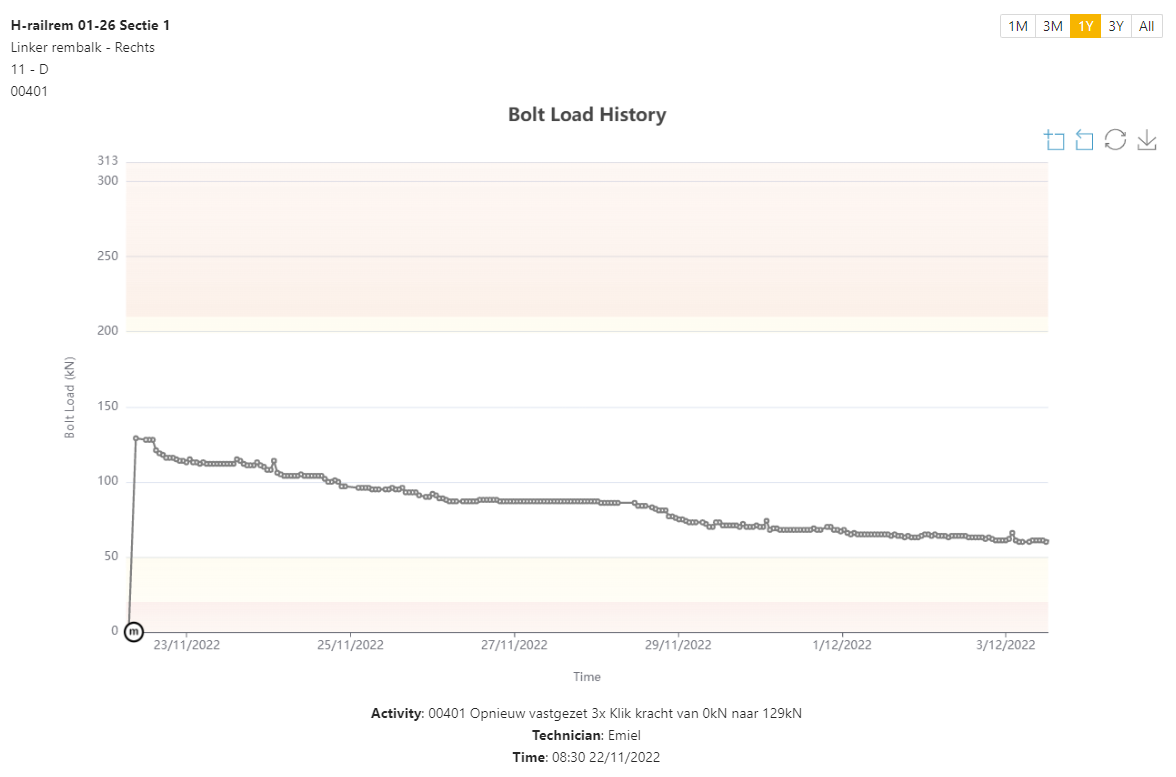
To analyse the long-term performance of a bolted connection, all bolt load samples captured from installation to decommissioning are stored in the cloud platform and can be viewed through the historical bolt load graph (pictured). This enables engineers to:
-
Assess the bolt load achieved at installation to ensure bolts are accurately tightened.
-
Quantify any settling and embedding losses which may occur over the first few weeks post installation.
-
Identify any vibration induced loosening or fatigue failures which may occur in the mid to long term.
The historical bolt load graph provides context around the bolt load measurements with the thresholds which would generate an alert overlayed as shown by the amber and red bands on the graph. Maintenance events (M in a circle) are also displayed to provide further insight as to any events which may lead to a sudden change in bolt load.
3D modelling
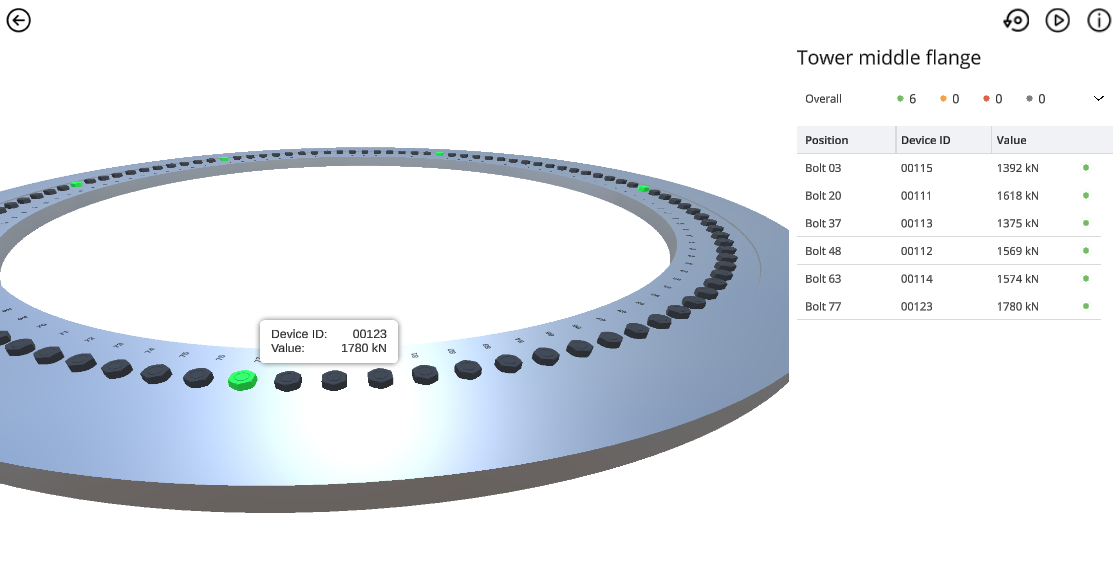
The InterBolt Cloud is an asset-centric platform that attributes bolt load measurements to a specific location on the asset. With this location data, we can overlay the bolt load data onto a 3D model of the asset itself. This helps Operations teams know exactly where the fault has occurred as well as helping them understand any impact on bolts in the near vicinity.
The InterBolt Cloud platform features a large range of 3D models from wind turbines to bucket excavators.
Actionable maintenance insights
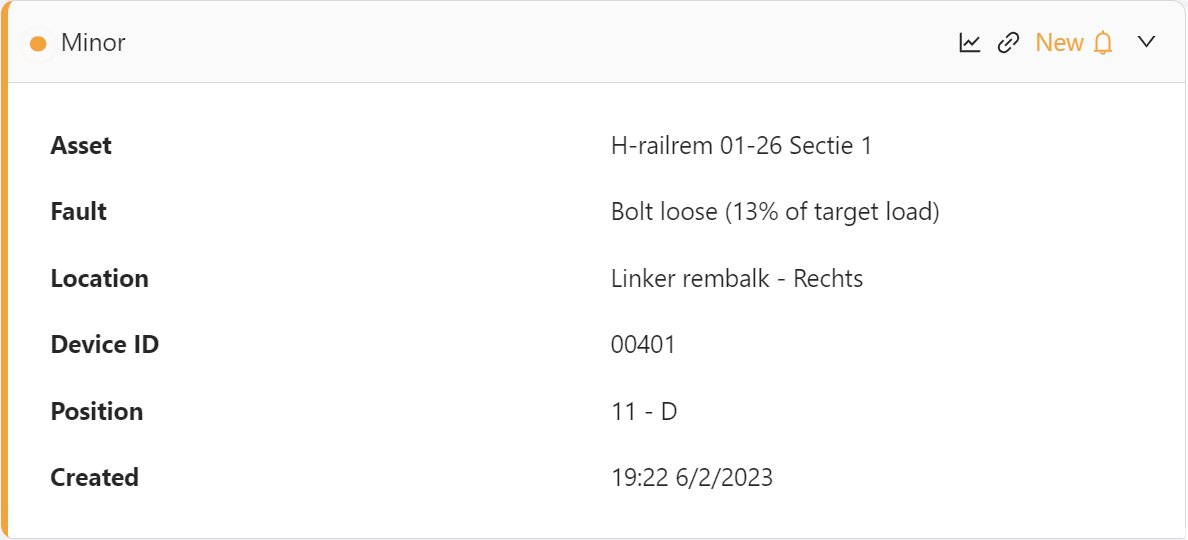
The InterBolt cloud platform features a simplistic analytics engine which can generate an alert when the bolt load exceeds a predefined threshold or is trending towards a certain state. Each alerts gives a clear overview of the fault type along with positional information for where the fault has occurred. All alerts link directly to the bolt load graph so users can graphically see the current and historic performance of the connection.
The alert thresholds are configurable on an individual bolt basis through the cloud platform. Different severity alerts can be generated to help Operations teams understand the urgency of the remedial maintenance.
The alerts generated in the cloud can also be sent to key stakeholders via email or SMS, to minimise the time between detection of a critical issue and remedial action being taken.
The alert feature ultimately means that Operations team don’t have to look at the bolt load reported by each InterBolt periodically to identify an issue. Instead, the cloud platform does this autonomously and provides maintenance insights which Operations teams can action.
Digital maintenance records
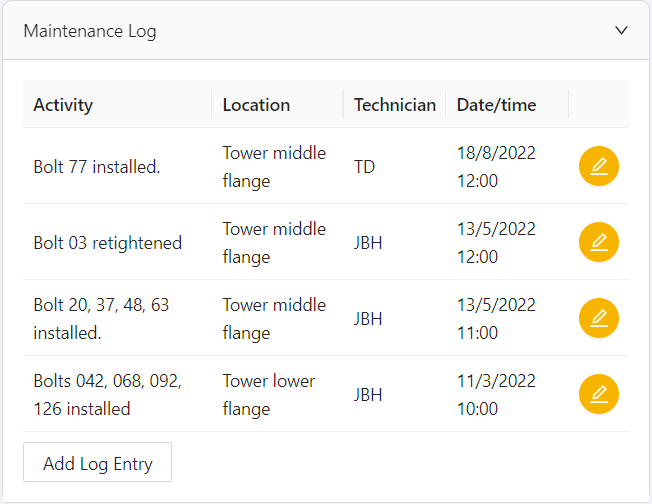
The InterBolt cloud incorporates digital maintenance records so that a full history of onsite activities from installation to decommissioning can be documented and correlated to bolt load measurements.
In the historical bolt load graph, maintenance events are displayed on the x-axis giving a clear description of the maintenance activity, timestamp and technician involved.

Live data access
Below is a link to the InterBolt Cloud platform for a live installation on the Offshore Renewable Energy Catapult’s Levenmouth Demonstration Turbine, funded through a project with the Offshore Wind Growth Partnership.
Site: dashboard.interbolt.co.uk/
Email: demo@interbolt.co.uk
Password: Intelligentbolting

